Product
One workspace from the first search to the first year of revenue.
Evaluate, design, underwrite, deliver the drawings, then track what actually happened. Each step feeds the next, so nothing gets re-keyed.
Evaluate
Everything about a site on one page.
Type an address and get a site report in seconds, or score a whole spreadsheet of addresses in one run.
- Existing and planned chargers nearby with posted prices, networks and port counts
- Traffic counts on the roads around the site
- Demographics in 1, 3 and 5-mile rings
- EV registrations in the area
- The serving utility, NEVI corridor distance and disadvantaged-community status
- Federal, state and utility incentives the site qualifies for
Design and estimate
Draw the site. The estimate keeps up.
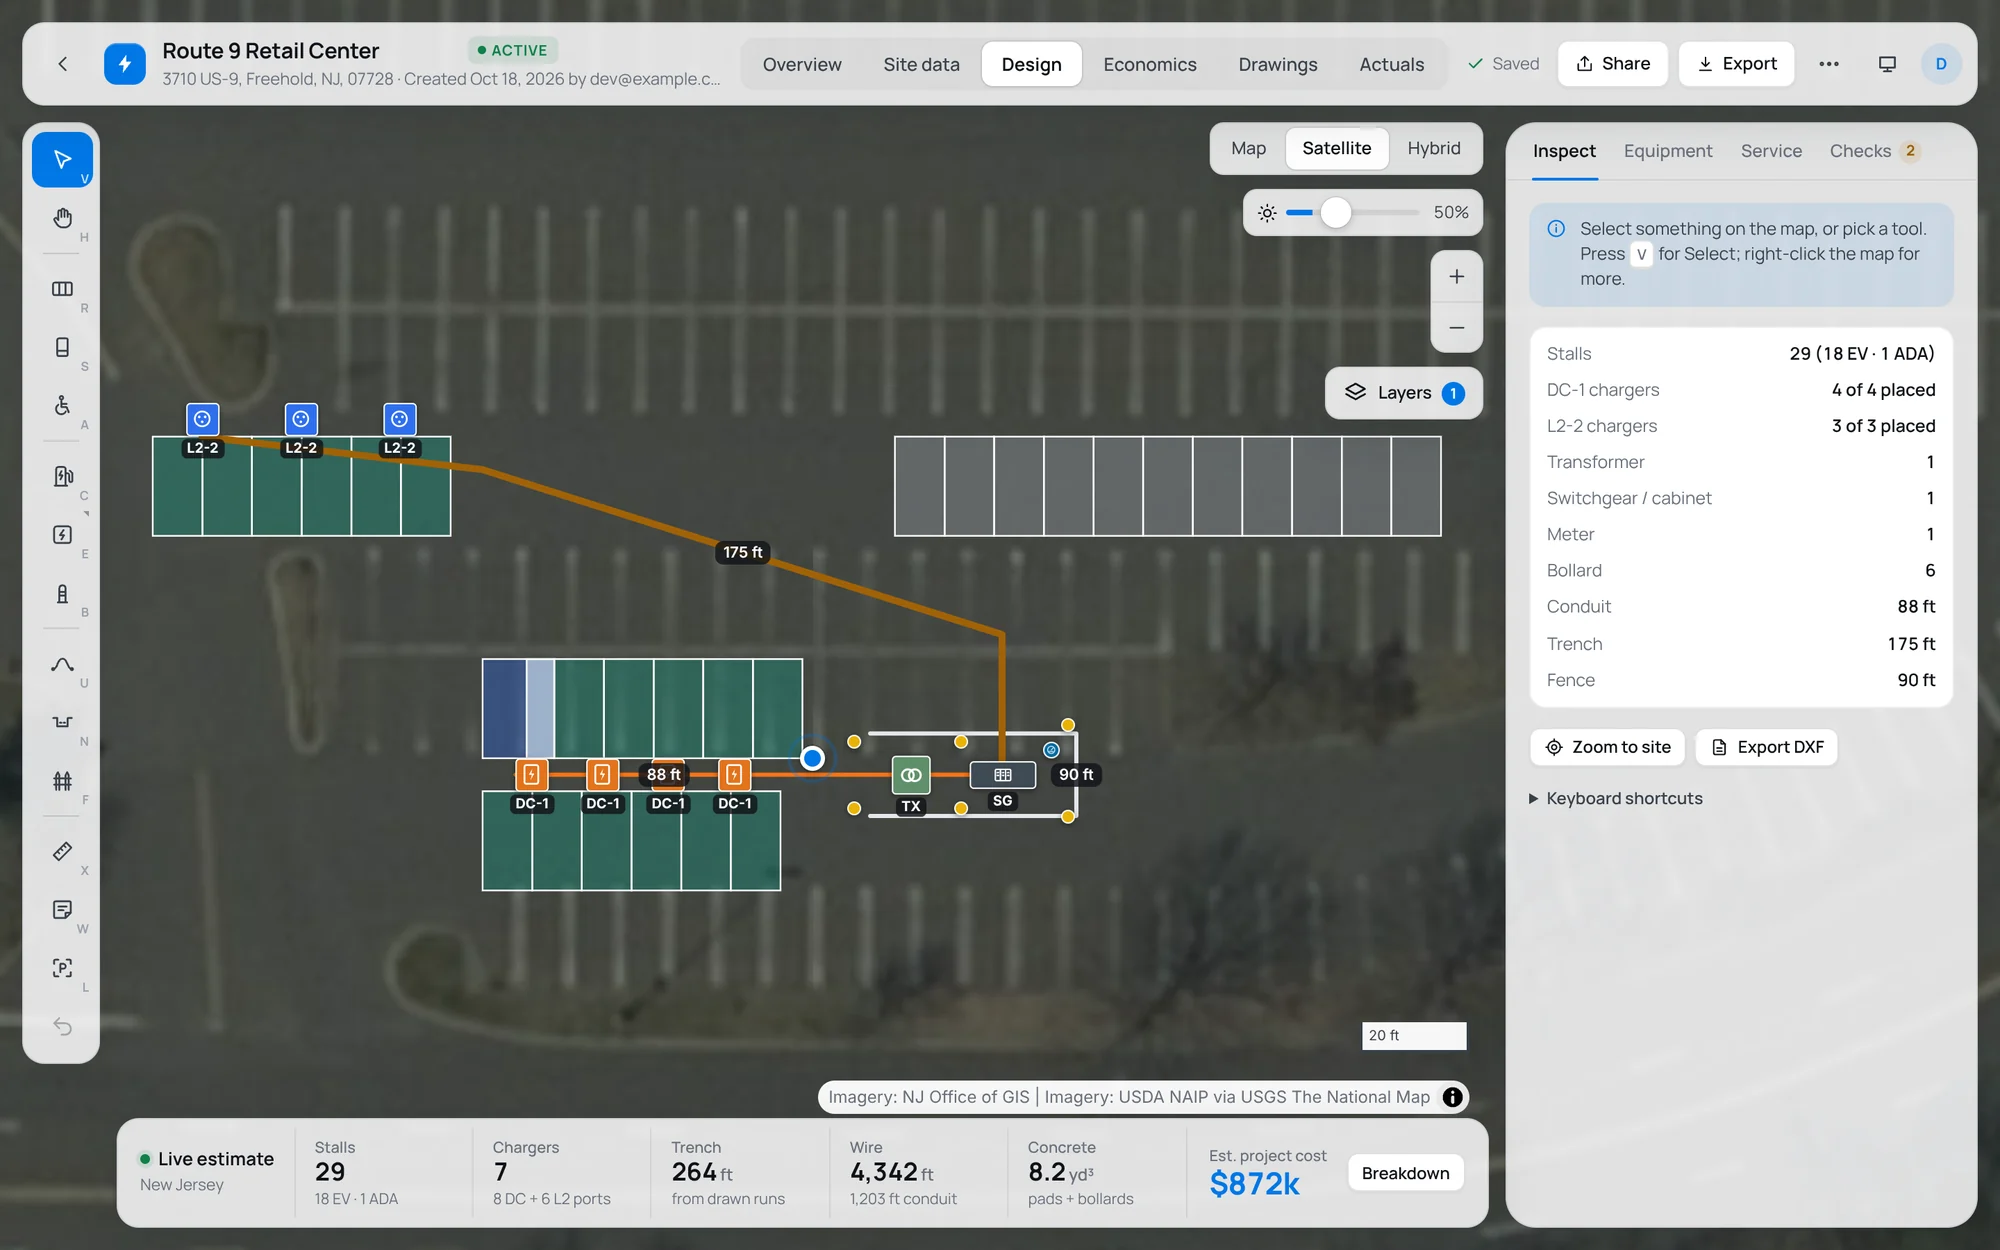
Lay out stalls, accessible spaces, chargers from a catalog of real models, the transformer, switchgear, conduit and trench on current aerial imagery.
- Parking lots detected from map data and filled with stalls in one click
- Live takeoff: trench, conduit and wire lengths, concrete and asphalt, by regional unit cost
- Estimate summaries: roll divisions into the groups your client sees
- Design checks: service capacity, cable reach, voltage drop, accessible stalls, bollards
- Darken the imagery so the design stands out; the setting is saved for everyone who opens the project
Underwrite
A pro forma built from the site, not a template.
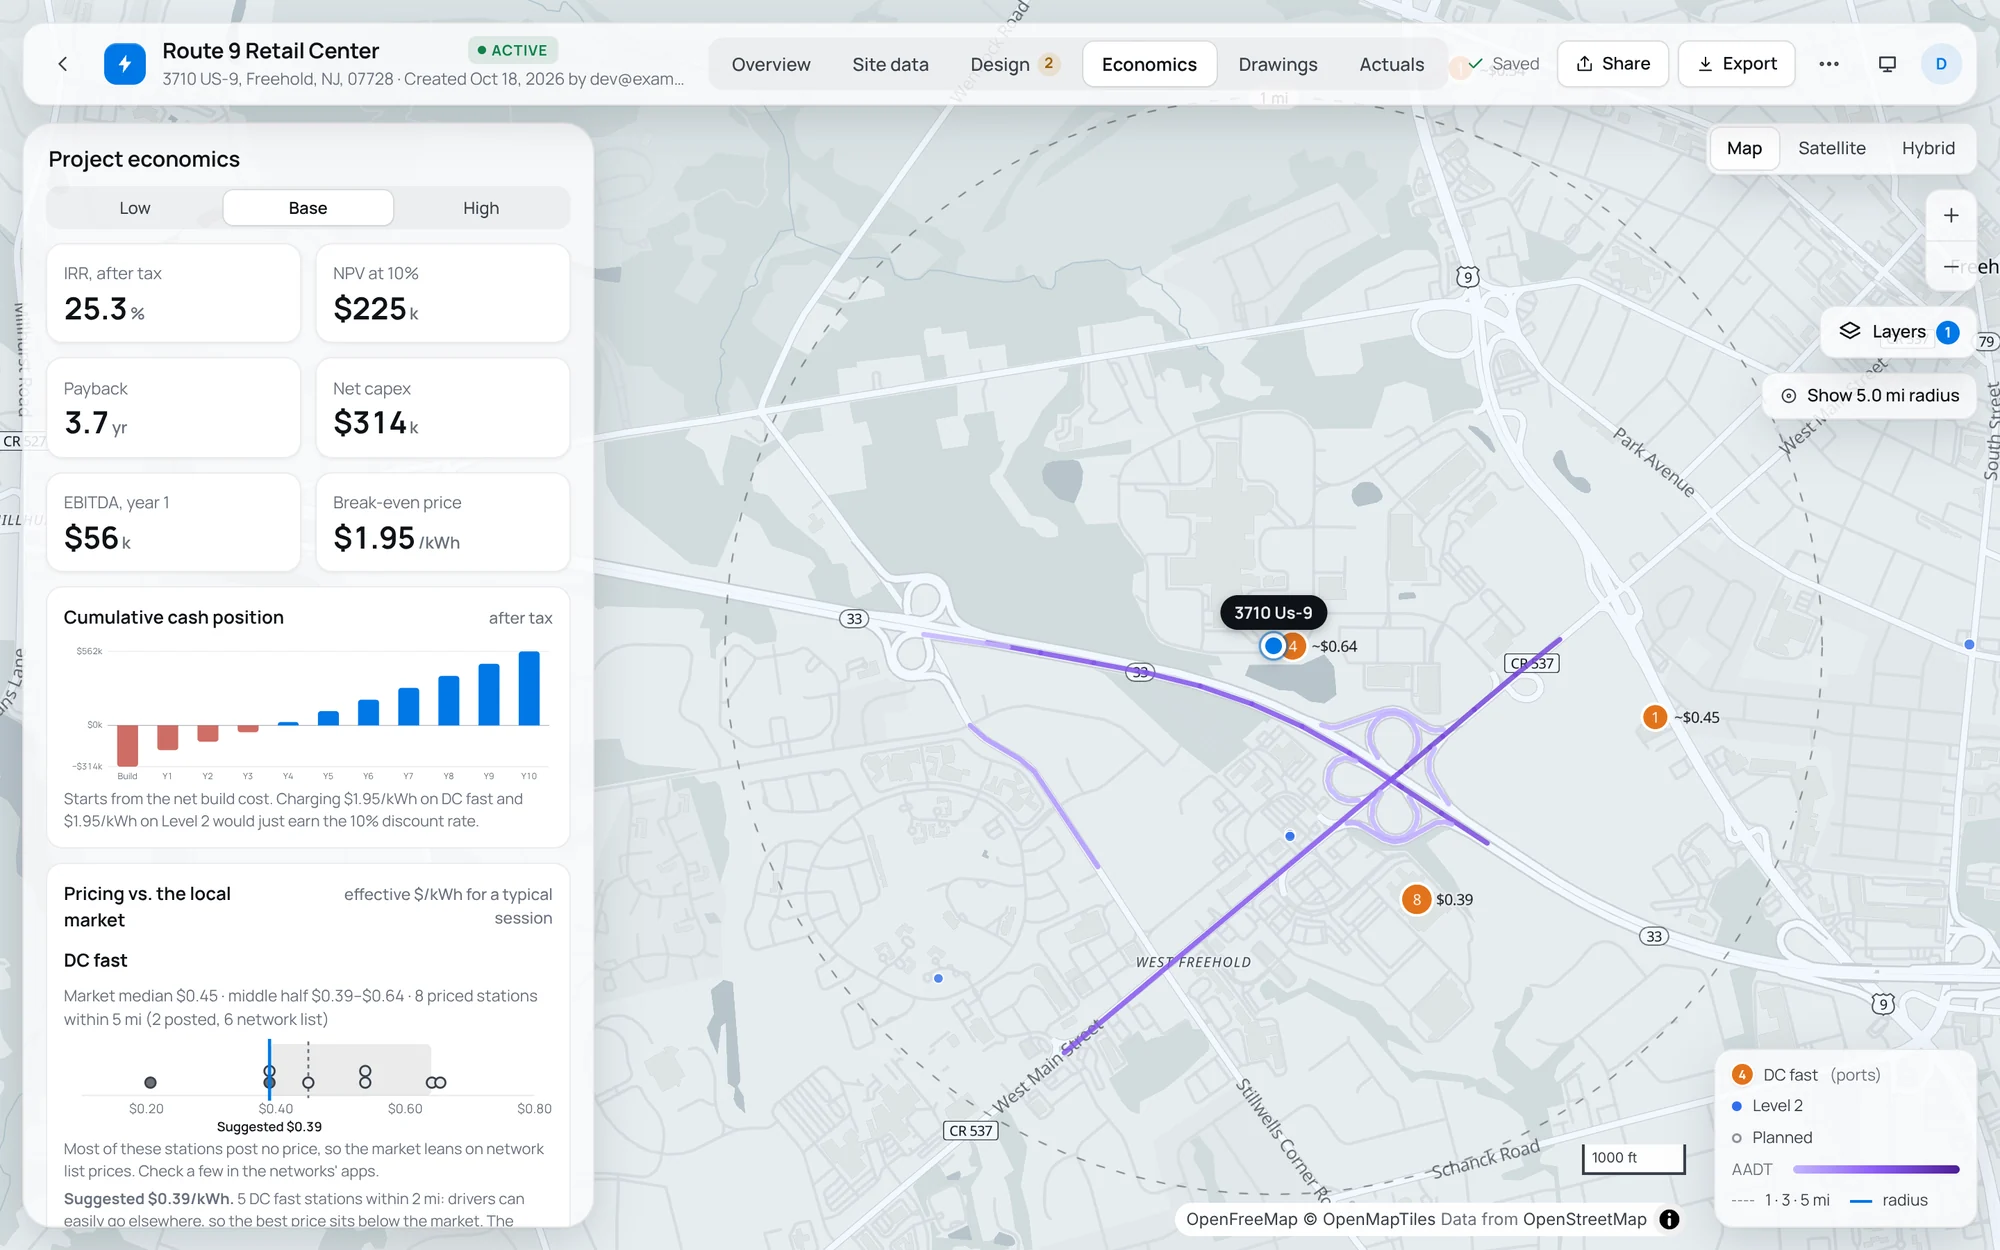
Every project gets a utilization forecast as soon as there's a charger in the design; Pro adds the full pro forma.
- Utilization forecast by site type with low, base and high cases, ramp-up and seasonality
- Electricity cost from the serving utility's rate schedules, demand charges included, picking the cheapest eligible rate each year
- A suggested price from the local market and how close the competition is
- Incentives priced against the capital cost; bonus depreciation; optional debt
- IRR, NPV, payback, break-even price and a downloadable pro forma
Plan sets and 3D
Drawings for the engineer, renders for the client.
Generate an 11 × 17 plan set from the design, with your logo in the title block.
- Site plan with keynotes, riser diagram and equipment data
- One-line diagram with circuit schedule, conduit sizing, load calculation and panel schedules
- Standard details and electrical specifications
- DXF export with layers for stalls, chargers, equipment, conduit and trench
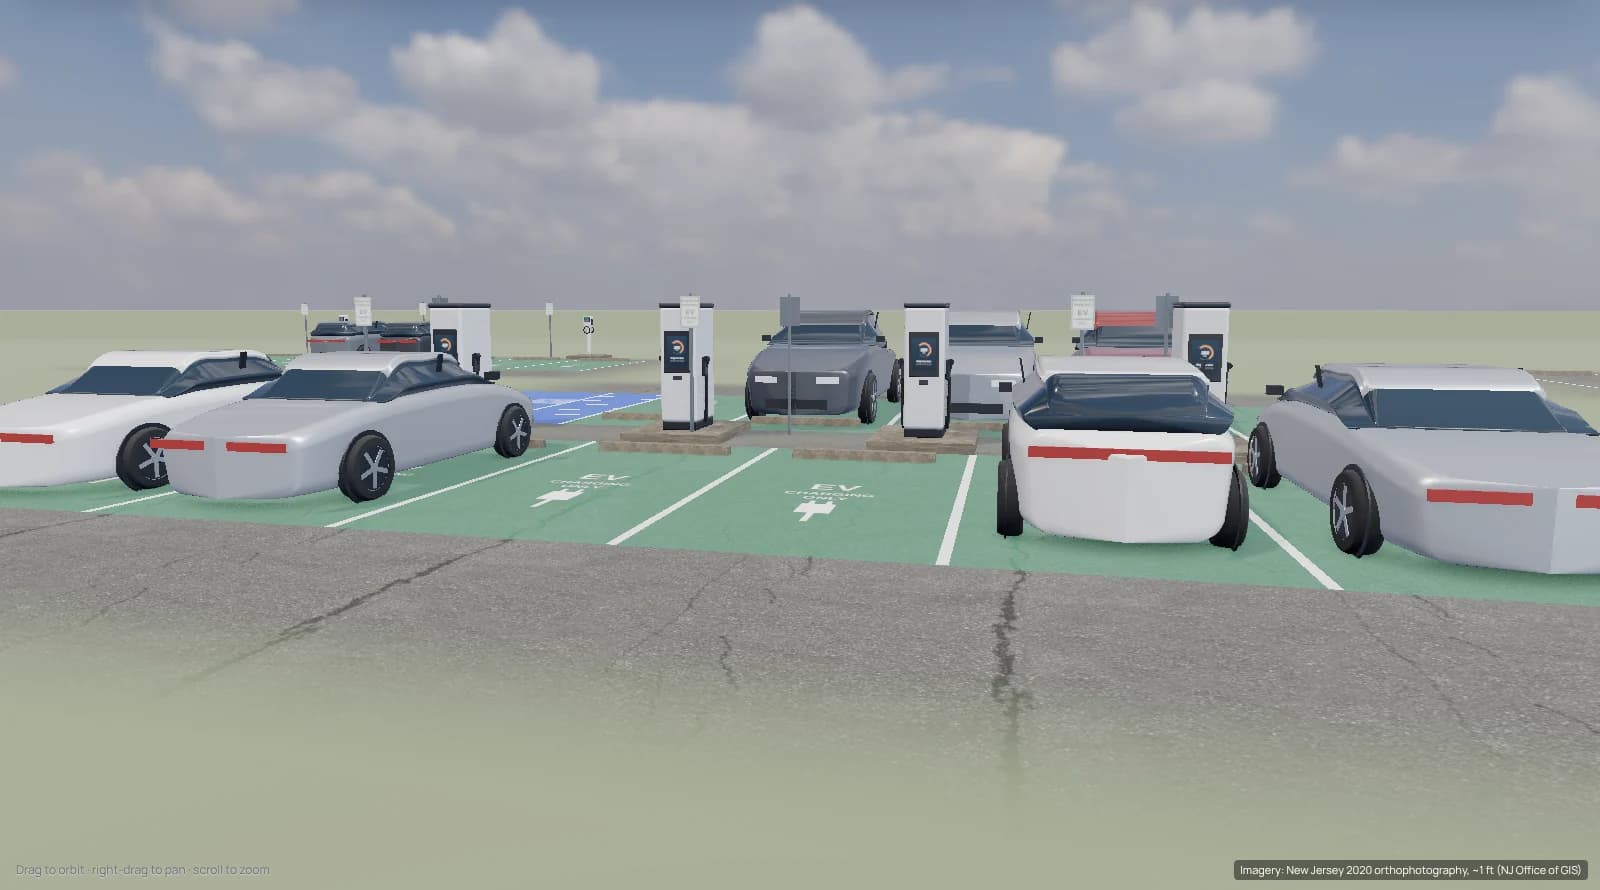
- Interactive 3D model of the finished site, saved as images or a 3D file
Track record
Then see how it turned out.
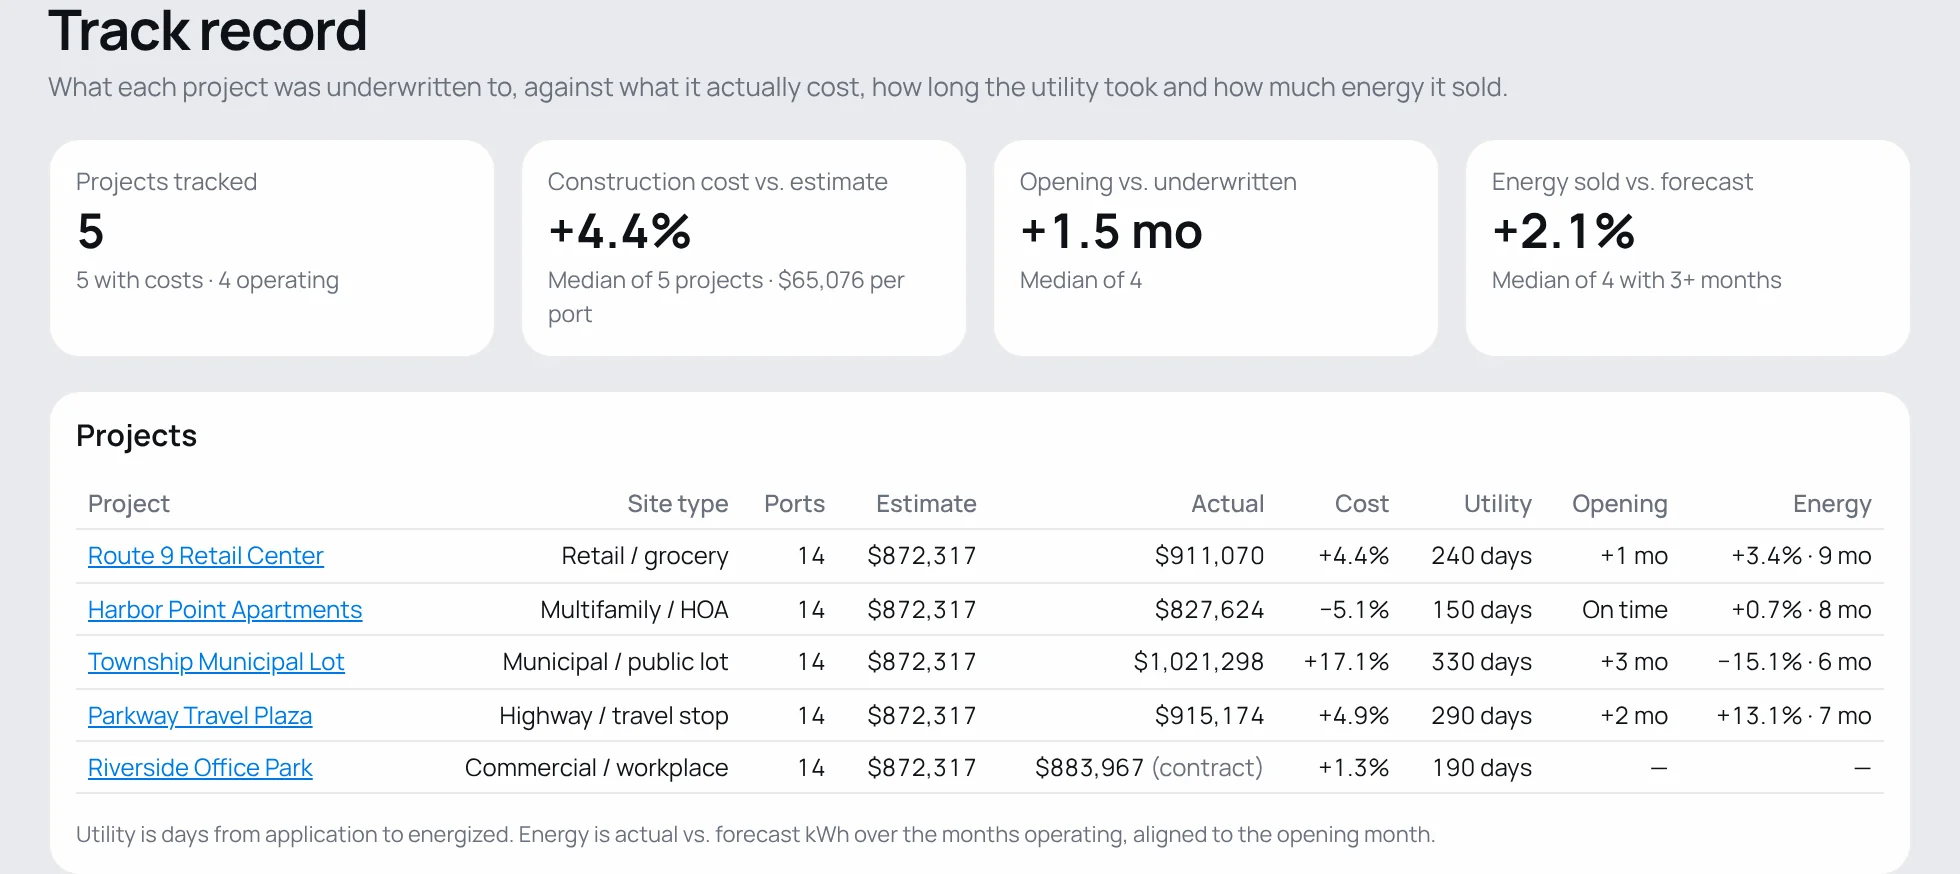
Lock the baseline and track bids, final costs, the utility timeline and monthly charging against it. Every project feeds your company's track record.
- Construction cost vs. estimate by division
- Utility lead times and upgrade rates by utility
- Energy and revenue vs. forecast, aligned to the actual opening month
Underwrite your next site in an afternoon.
Start free with three projects. Bring a site you know well and see how the forecast compares.